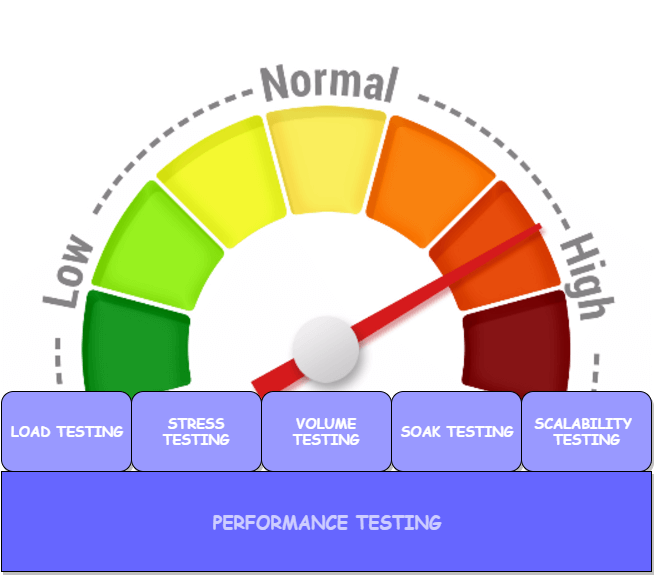
Performance testing is a very vital part of testing any application. Whether it be a web application, mobile app, embedded software, firmware or api’s, it is essential for any system or application to perform correctly, fast and reliably.
We help you identify and fine tune key performance requirements for your applications. For every business it is important to be efficient and reliable to its users. We not only perform load, stress tests but we also find out threshold points for your system/applications. These vital performance details help you better your software and also provides you with statistical information which can be helpful in planning future change requests or newer versions of the software.
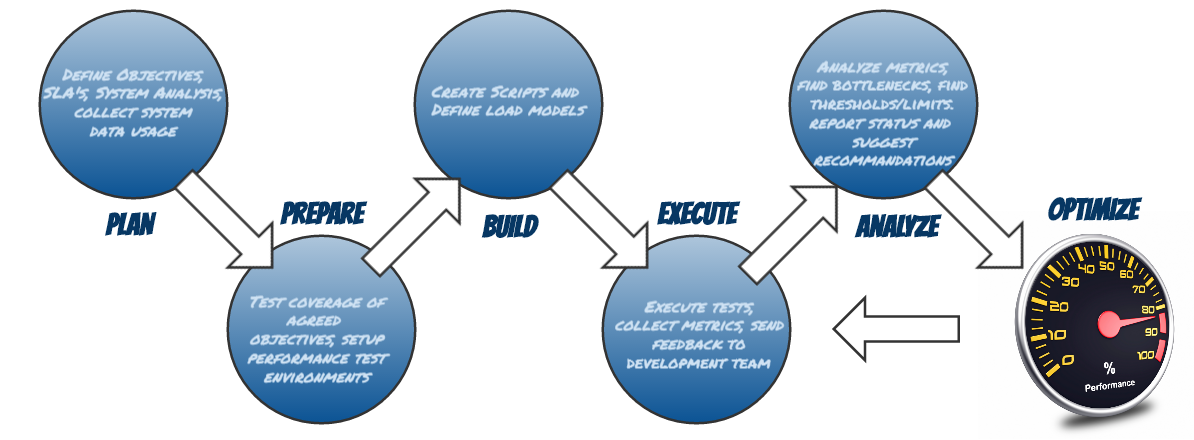
In our approach we start with Performance test plan which consists of the test approach and what kinds of objectives we plan to accomplish when performance testing is finished.
Load tests, Capacity tests, Endurance tests and stress tests are executed using pre-defined Data models: number of data records in system, number of concurrent users at any specific time based test, Data models for peak time and normal times of application use.
The cycle of performance tests will be executed till the system under test has achieved the desired results and objectives are met as defined for each specific case.
Some of the performance metrics and other technical data collected includes:
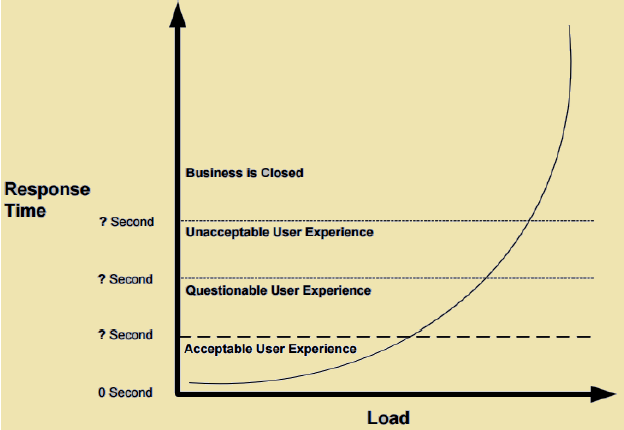
- Response times – in normal and extreme situations
- Acceptable response times per scenarios
- Transaction average response time summary vs Load
- Throughput vs Load
- Transactions per second
- Error Statistics
- Network Statistics
- Network bandwidth utilization summary
- Server Statistics
- Component Monitoring
- API call response times, thresholds, per minute and per seconds transactions
- System or client side errors Vs first time load when the first error was reported by tool
- Problematic components/services
- Scalability matrix and scalability factors
- Failures in Services
- Delays in business logic processing
An executive summary will be prepared with findings and recommendations if any, for improvements of application/system.
The table below describes an example of various performance metrics captured during a performance test stage to view resource usage trends:
| Metrics | Value Measured |
|---|---|
| CPU Utilization | CPU Utilization |
| Memory | Memory Utilization |
| Java Virtual Machine (JVM) Runtime/Total Memory |
Total Memories in the JVM runtime |
| JVM Runtime/Free Memory | Free Memories in the JVM runtime |
| Used Memories in the JVM runtime | |
| JDBC DB Connections/Concurrent Waiters | Number of threads that are currently waiting for connections |
| JDBC DB Connections/Percent Used | Average Percent of pool that is in use |
| JDBC DB Connections/Percent Maxed | Average Percent of the time that all connection are in use |
| Thread Creates | Total number of thread creates |
| Thread Destroys | Total number of thread destroyed |
| Thread Pool/Active Threads | Number of concurrent active threads |
| Thread Pool/Pool Size | Average Number of threads in pool |
| Thread Pool/Percent Maxed | Average Percent of time when all threads are in use |
| Heap Size | Amount of heap allocated |
| Memory | Memory Utilization Processes in run queue(Procs r), User Time (cpu us), System Time (cpu sy), Idle Time (cpu id), Context Switching (cs), Interrupts |
| Disc I/O | Disk I/O Utilization Read/Write per second (r/s w/s), Percentage Busy (%b), Service Time (svc_t) |
| Network | Collisions (collis), Output Packets (opkts), Input Errors (ierrs) , Input Packets (ipkts) |
| Queue Depth | Measurement of queue depths during the test execution |
Please check our other best TaaS Services like Web TaaS, API TaaS, Mobile TaaS TaaS, IoT API LAB, Manual Testing, Functional Testing, Integration Testing